Five-year summary
Five year review | 2025 | 2024 | 2023 | 2022 | 2021 |
|---|---|---|---|---|---|
Income and inflows, SEK bn | |||||
Net flows to/from pension system | -4.6 | -2.0 | -4.8 | -4.7 | -7.5 |
Profit for the period | 32.6 | 51.3 | 36.2 | -29.2 | 86.8 |
Fund capital as per December 31 | 577.1 | 549.1 | 499.8 | 468.4 | 502.3 |
Return and expenses total portfolio, % | |||||
Return before expenses | 6.1 | 10.4 | 7.8 | -5.7 | 20.8 |
Operating expenses | 0.07 | 0.06 | 0.06 | 0.05 | 0.05 |
Commission expenses | 0.01 | 0.01 | 0.02 | 0.02 | 0.03 |
Return after expenses | 6.0 | 10.3 | 7.8 | -5.8 | 20.7 |
Inflation | 0.3 | 0.8 | 4.4 | 12.3 | 3.9 |
Real return after expenses | 5.7 | 9.4 | 3.2 | -16.1 | 16.2 |
SEK bn | |||||
Return | 33.0 | 51.6 | 36.5 | -28.9 | 87.1 |
Operating expenses | 0.4 | 0.3 | 0.3 | 0.3 | 0.2 |
Return after expenses | 32.6 | 51.3 | 36.2 | -29.2 | 86.8 |
Annual return after expenses % | |||||
Five years | 7.5 | 8.2 | 9.59 | 8.1 | 11.3 |
Ten years | 8.3 | 8.4 | 8.68 | 9.3 | 11.1 |
Risk | |||||
Risk (1-yr standard deviation), % | 6.8 | 6.0 | 5.0 | 8.4 | 5.2 |
Sharpe ratio | 0.9 | 0.8 | neg | 4.0 | |
Risk (10-yr standard deviation), % | 6.7 | 7.0 | 7.0 | 6.9 | 6.3 |
Currency exposure | |||||
% of total portfolio 1) | 22.2 | 23.1 | 17.9 | 19.0 | 21.1 |
External management | |||||
% of total portfolio | 19.5 | 18 | 22.2 | 22 | 31 |
Asset management expenses % of assets under management | |||||
Operating expenses | 0.07 | 0.06 | 0.06 | 0.05 | 0.05 |
Operating and commission expenses | 0.08 | 0.07 | 0.07 | 0.08 | 0.08 |
No. of employees | 802 | 72 2) | 70 2) | 66 | 61 |
Read more
 AP3 has been investing in different types of insurance-, climate- and weather-related securities since 2008. Holdings include catastrophe bonds, which are traded outside the traditional financial markets. Returns on these instruments have a low correlation with other investments, which means they help to diversify the portfolio.
 Private Equity is the name for investments in the share capital of companies that are not listed on a stock market.
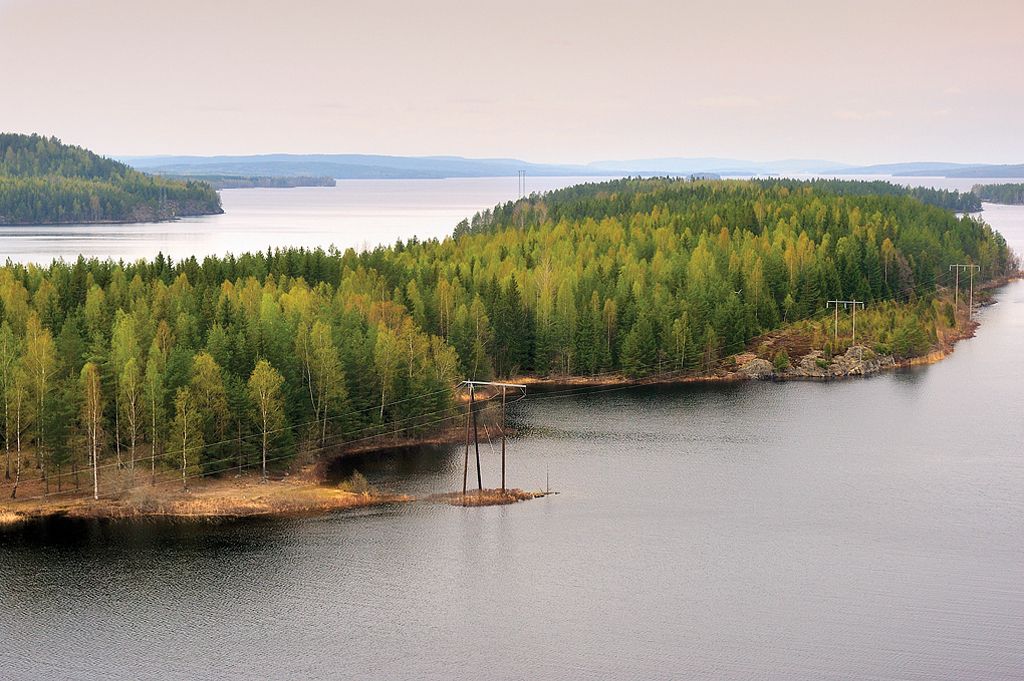 Alternative investments account for around 34% of the AP3 portfolio. They consist of private equity funds, real estate, infrastructure assets, timberland and insurance-related investments.